I'm a software developer and mathematician with a focus on using the web to visualize, understand, communicate ideas about the world around us. I was once a mathematics professor, but I have spent most of my career doing software development. Since 2016 I work at Google on large-scale graph processing algorithms and visualization. This web site gives an overview of some of my work before that.
I enjoy bridging the gap between science or mathematics research, and high quality software development. I bring the precision and thoroughness of mathematical thinking to software engineering. I love to bring science and math to life in software, turning scientific exploration and discovery into robust, working systems that help us understand and communicate how the world works.
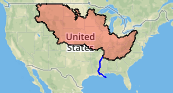
This application shows long-term temperature change in the 20th century at about 2000 NOAA weather-monitoring stations across the United States. I wrote this as a demonstration of one way to visualize a large amount of station-based time series data. It uses real temperature data from NOAA's GHCN daily data set. It uses data through 2016 because that's when I wrote it. It's written in JavaScript using Leaflet.js for the map, and Multigraph and d3.js for the graphs. Here's a short video screencast that explains the application. The application source code is on GitHub. I did the data analysis in Clojure using Incanter; my Clojure code for this is also on GitHub.

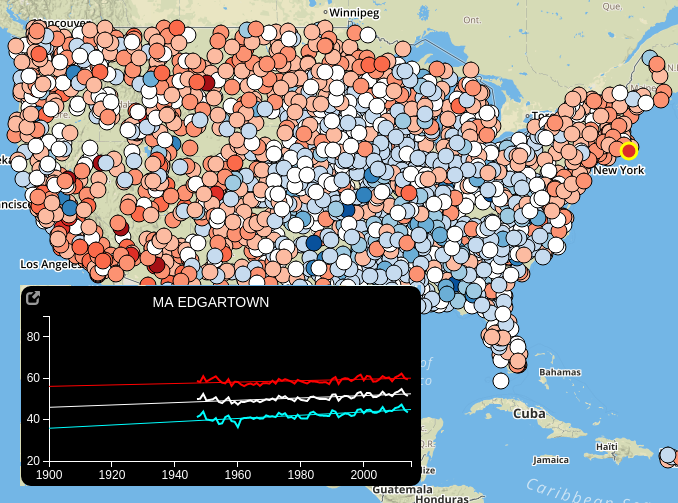
I'm one of the founders of FernLeaf Interactive, LLC, a technology-enabled climate resilience consulting company. I I was the CTO from 2013 until 2016, and was the principal architect and lead developer for all of FernLeaf's environmental data analytics and visualization software products. I also designed and implemented an Extract/Transform/Load (ETL) system for FernLeaf's climate and environmental data warehouse that maintains a database of over 6 billion data records in a format optimized for rapid access and visualization. The system downloads and processes over 2 million new records each day. It's written in a combination of Python for data analysis using the Pandas library, Clojure for concurrent downloading of thousands of documents, and C for fast parsing of ASCII data files. For more information about FernLeaf's products, see fernleafinteractive.com.

I am the principal architect and author of Multigraph, a JavaScript library for creating interactive two-dimensional X-Y data plots in web pages. It can read data in a variety of formats and provides interactive pan and zoom capabilities. Multigraph can read data from a web service, which allows it to be used to "surf" through large datasets, downloading only those the parts of the data that are needed for display.
Multigraph started out in 2003 as a Java applet that worked with XML configuration files, had a short stint as a JavaScript program using SVG around 2008, then went through a period of existence as a Flash application until 2012, when it was reborn as a modern JavaScript program that uses HTML5 Canvas for fast rendering and now deals with JSON data.
Multigraph is used extensively on NOAA's National Climatic Data Center web site, on the NOAA climate.gov site, and is the basis for several of the other applications mentioned on this page. It's an open source project with its own multigraph.org web site with documentation and examples; it's free for anyone to use.
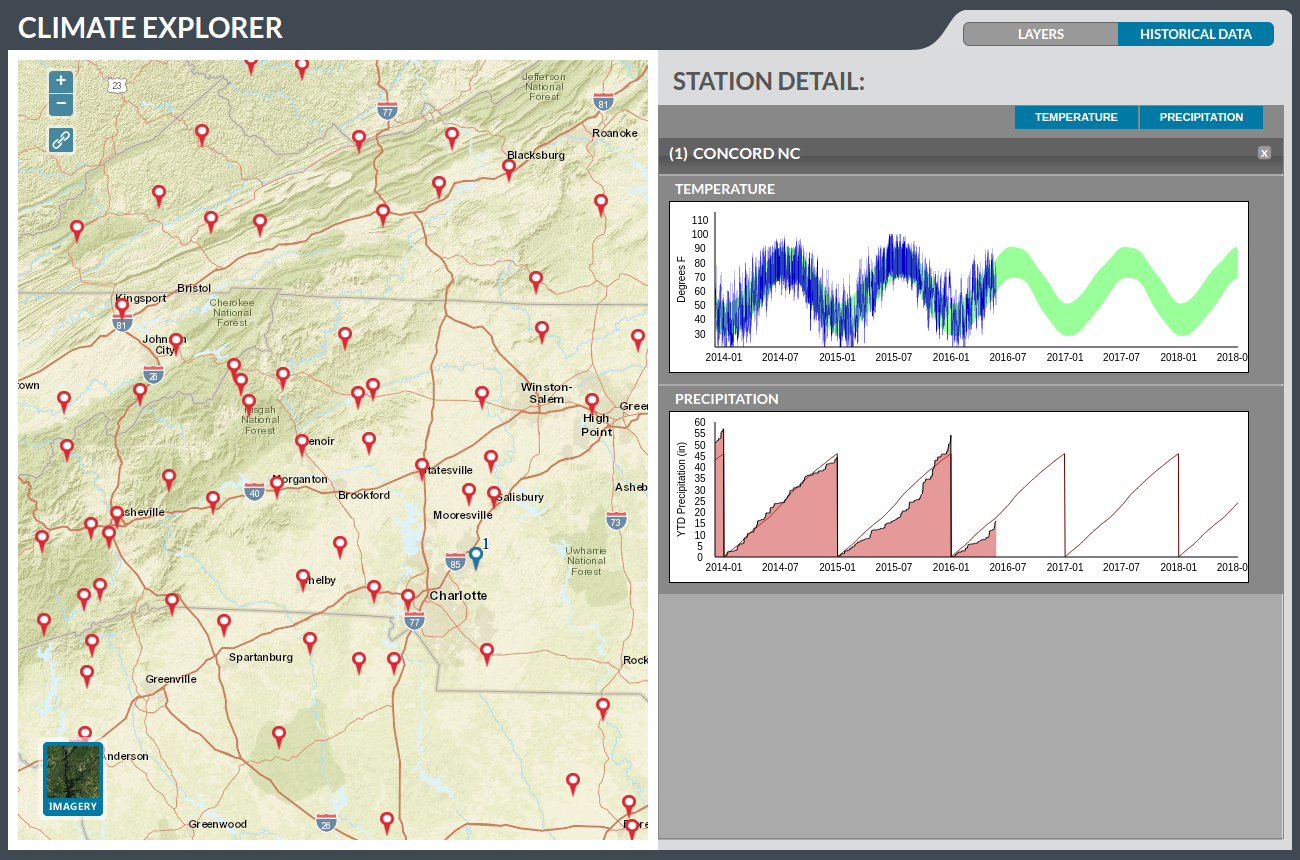
I architected and led the coding for the Climate Explorer application that is part of the US Climate Resilience Toolkit. This web site, which was highlighted by President Obama in May 2015, is devoted to helping communities understand how to better prepare for climate change. The Climate Explorer application lets users interactively explore the climate history of their location. It's written in JavaScript using OpenLayers and Multigraph, and also includes a Java back-end ETL system that maintains a database of over 100 years of climate data from about 40,000 locations, in a format that is optimized for rapid download and visualization in the application. The application source code is on GitHub.
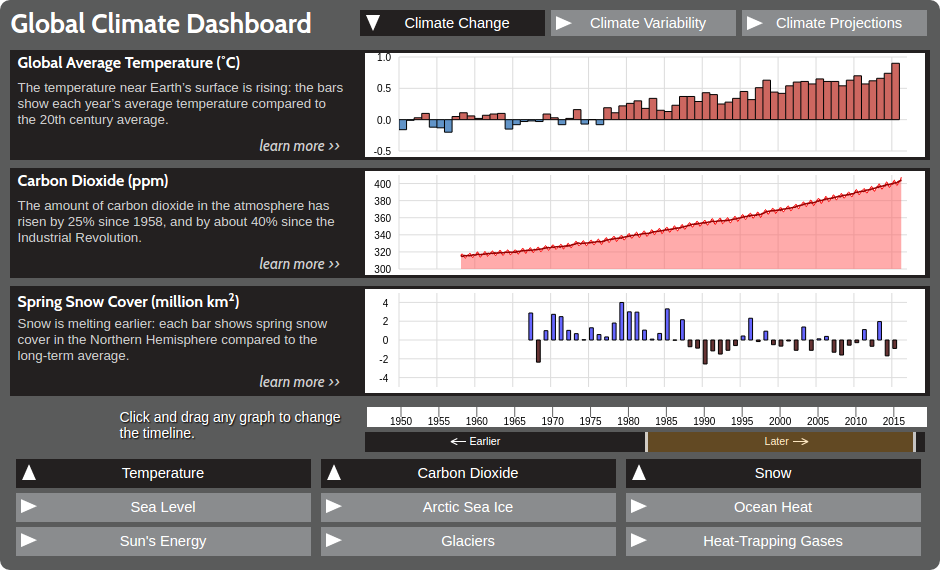
Much of the conversation about climate change focuses on rising temperature, but what other kinds of environmental things could we measure that might give an independent indication of whether the planet is on a warming trend? One idea would be to measure the total surface area covered by snow each winter. Or the total amount of sea ice in the arctic. Or the sea level (water expands with heat, so as the planet warms we'd expect the sea level to rise). This JavaScript application that I wrote for the home page of NOAA's climate.gov provides a simple visual way to explore these and several other global data sets and see how their change over the last few decades compares to the earth's change in temperature over the same period. The application uses 15 data sets that have been thoroughly vetted by the scientific community, and includes a non-public back-end administrative interface using PHP and Drupal that NOAA staff uses to keep the data updated on a regular basis. The code for the application itself as well as the administrative backend is on GitHub.
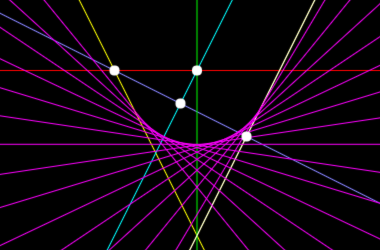
This joint project with my colleage Charles Gunn is the beginning of a ClojureScript library for computation and visualization in 2-dimensional projective geometric algebra. It includes a small domain specific language (DSL) for creating interactive diagrams; you can view several of these diagrams online, and the source code is on GitHub.
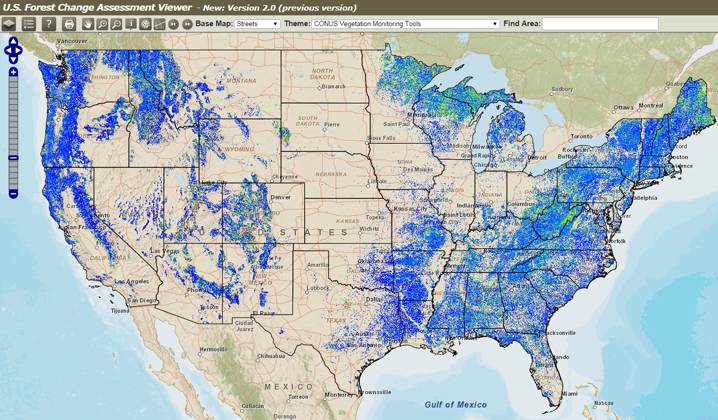
I architected and led the development of this application for the US Forest Service's Eastern Forest Environmental Threat Assessment Center, which shows a weekly updated view of detected changes in the US forest cover derived from MODIS NDVI satellite data. The user facing front-end is written in JavaScript using the OpenLayers map library, and the system also includes a Python back-end that uses the GDAL and NetCDF libraries to process and archive new raster data sets which Forest Service staff upload each week, and MapServer and PostGIS to provide RESTful web services which support the application. The application is part of the Forwarn web site and is available for anyone to view. The source code is on GitHub.
As the senior technical staff member at UNCA's National Environmental Modeling and Analysis Center (NEMAC), I led a staff of 3-5 programmers and designers in software development and web site construction projects. One of my main activities while there was to transition the group from serving production applications from Windows to Linux servers, and then eventually to a cluster of EC2 instances in Amazon Web Services. This involved setting up a version-controlled provisioning system with puppet, establishing a formalized process for deploying applications to production servers, and training the staff in that process.

An interactive 3D geometry viewing program that can display 3- and higher-dimensional objects in Euclidean, hyperbolic, and spherical space, Geomview was written at the Geometry Center at the University of Minnesota between 1992 and 1996 by me, Stuart Levy, Tamara Munzner, and a lot of other people. It's written in C using OpenGL. Several years after the Geometry Center closed in 1998, I set up the Geomview web site at www.geomview.org and transitioned the program to the open source community. Although there is not much active development on it any more, it is still used by many people around the world and is available in most Linux distributions.

ISIS is a flexible metadata storage and management system for weather and climate monitoring stations. It provides for entry, viewing, and storage of arbitrary metadata schemas, and tracks and displays the history of metadata values over time, as well as current values. I developed ISIS using Java and Spring Framework for NCDC in 2006.
The Climate Reference Network (CRN) is a network of highly automated long-term NOAA climate monitoring stations. Its goal is to provide extremely accurate and consistent observations of temperature and precipitation for a period of 100 years or more. In 2003-2007 I developed a Perl-based ETL system for receiving GOES satellite transmissions of data from CRN stations, processing it, storing it in an Oracle database, and making it available for download. I also developed a Java-based web site to give the public access to download and view graphs and reports of the data.

I wrote C++ the driver that the GDAL (Geospatial Data Abstraction Library) uses to read vector data files in the US Census Bureau's Tiger/Line data format.

I was part of the small team that created the first version of WebEq, one of the first software products to support mathematics equation notation in web pages, and the very first program to support the MathML standard. WebEq was written in Java at the University of Minnesota Geometry Center in the mid 1990s. Geometry Technologies, which spun out of the Geometry Center, commercialized WebEq and eventually sold it to Design Science.
The WebEq product line has long since been retired and support for math equations in web pages is now provided by much more modern JavaScript software libraries such as MathJax (also written by a Geometry Center alumn, Davide Cervone), but WebEq retains its place in history as one of the first significant software building blocks that allowed the web to be used as a medium to communicate mathematics and science.

Interactive Watershed Map
This application shows how water flows across land. It lets you immediately see all the area that is both upstream and downstream from any location in the United States. It's based on data from the USGS, is written in JavaScript using Leaflet.js and TopoJSON, and uses HTML5 Canvas rendering to provide fast interactivity. It works in any modern desktop or mobile web browser. You can check it out yourself; the source code is on GitHub. You can watch a video of me giving a 10 minute !!Con 2016 talk about it on YouTube.